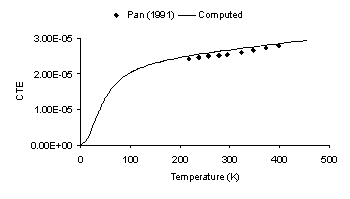
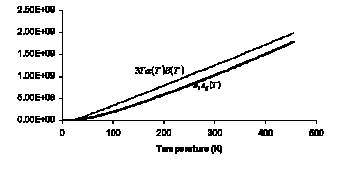
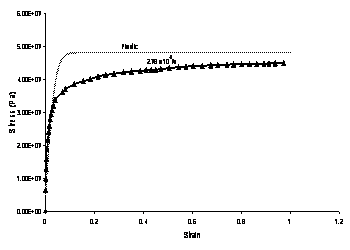
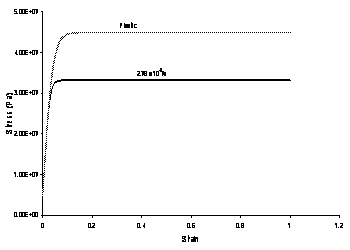
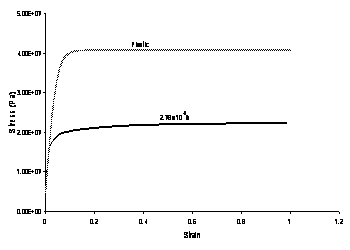
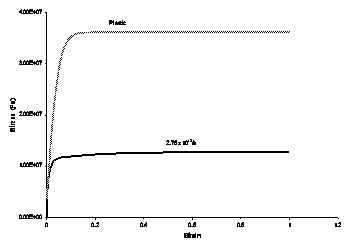
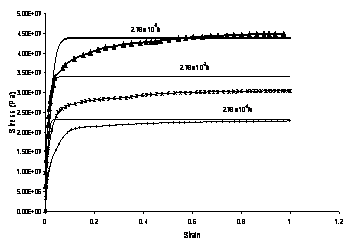
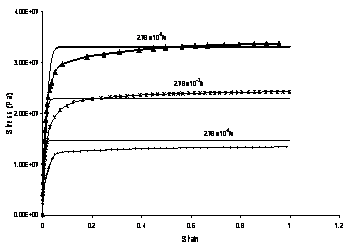
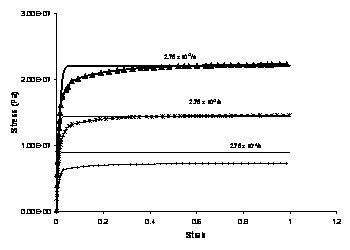
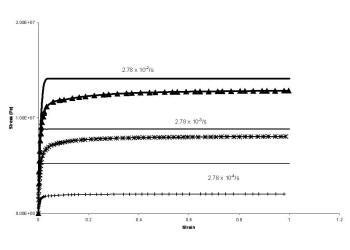
Solder is an alloy of lead and tin, and averaged properties were determined to compute the number of atoms per unit volume at 0K, the packing fraction and the molar specific heat. Plastic yielding was modeled by assuming the highest strain rate curve at the lowest temperature available to be close to the true plasticity curve. Thus, unlike the simplified rate-dependent simulations or the Perzyna viscoplastic solder simulations, the thermomechanical model incorporates plastic and creep strains separately.
For the
elastic part of the
thermomechanical model,
for consistency of procedure in the code, the number of particles per
unit volume was computed by assigning an average weight to the atoms to
get an equivalent atomic weight. This is simply an intermediate step in
the procedure, and thus, not relevant to the results. The atomic weight
was assigned based on the computation that the number of atoms in
eutectic solder is approximately 24% Lead and 76% Tin. Similarly, an
average bonding energy was assigned to the atoms. The actual value of
the bonding energy is not critical as it is used in conjunction with the
empirical scale factor h. Finally,
since at 0K both Lead and Tin are in the fcc state, a packing fraction
of 0.74 was maintained for solder.
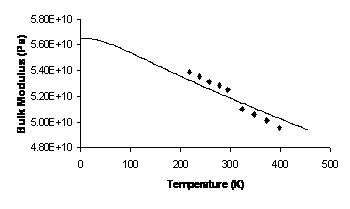
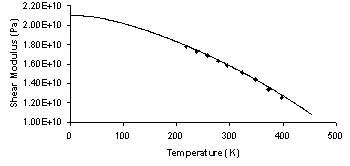
Experimental values of the Young’s modulus, E, and Poisson’s
Ratio, n, have been provided for
certain values of the temperature by
Pan (1991) from which observed
values of bulk modulus and the shear modulus may be obtained.
For estimating the 0K value of the bulk modulus, B0,
along with the empirical scale factor h,
predictions for the variation of both the coefficient of thermal
expansion and bulk modulus with temperature were curve-fit
simultaneously. No formal optimization was required as the variation of
material parameters with temperature is quite systematic with the
parameters B0 and h.
Similar to the case for Tin, the latent heat of fusion requires
empirical modification for solder. The shear modulus at 0K, G0
and the modified UL were determined by obtaining the
best fit values for the material parameters to the curve for the
variation of shear modulus with temperature. For simplicity, the
specific heat used was the weighted average value for Lead and Tin based
on the Kopp Neumann rule which is frequently assumed to be valid for
alloys, although it is intended for compounds (Reed and Clark, 1983).
Solder Properties for Thermoelastic Modeling
|
Property |
Value |
|
r0 (kg/m3) |
8400 |
|
AW (g/mole) |
(Av.) 139.943) |
|
W0 (eV) |
2.8 |
|
rf |
0.74 |
|
M.P. (K) |
456 |
|
TD (K) |
- |
|
B0 (Pa) |
56.5 x 10⁹ |
|
G0 (Pa) |
21 x 109 |
|
UL (J/mole) |
Scaled: 1400 (Actual: 5236) |
|
h |
8.00 |
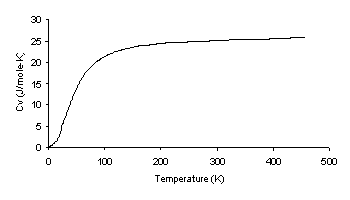
Molar Specific Heat Averaged from Lead and Tin
